Gantt4Excel videos
Using Gantt4Excel
1 - Setting up basic data for a Gantt chart
After launching Excel you will find the tab among the Excel menus. This tab opens the ribbon which includes the G4E button
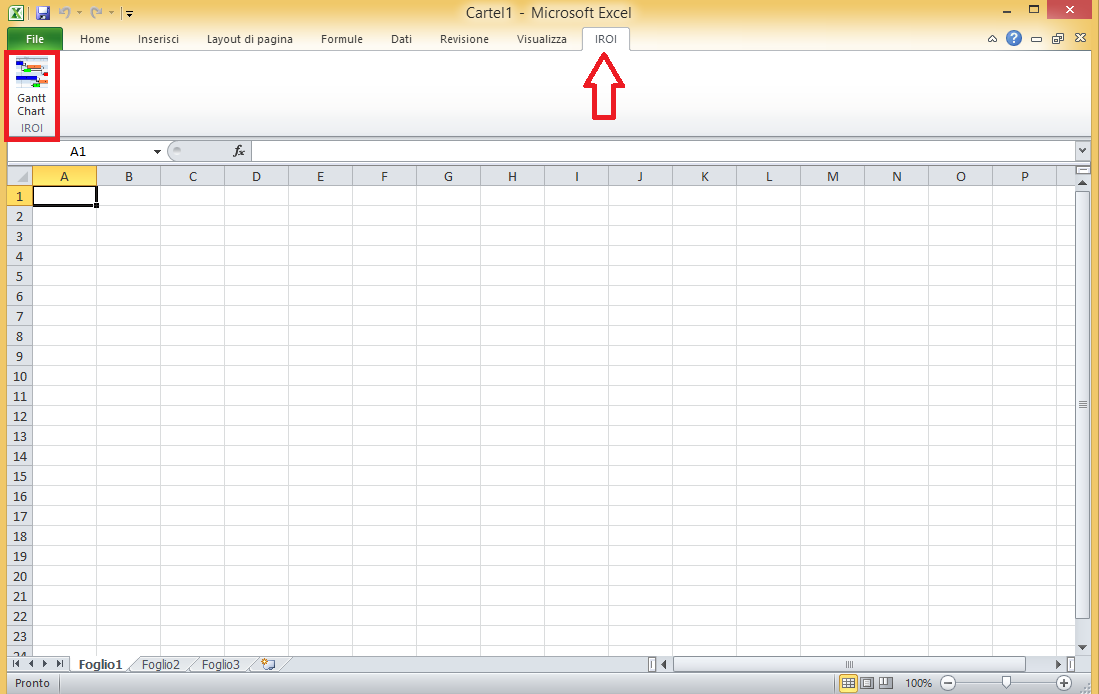
Clicking on it you can switch on and off the Gantt Chart pane. By default this pane appears in the right side of the current worksheet.
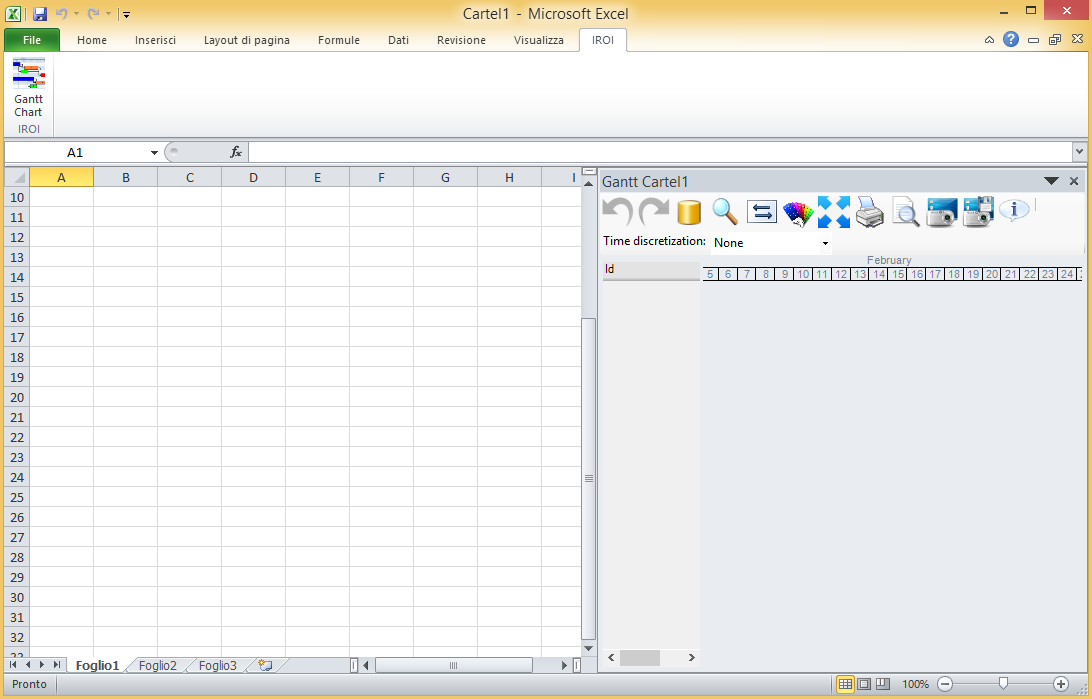
Clicking the Select Data button (IE the yellow cylinder) will open the Select Data window where you can specify all the data useful to your chart. All these data must be contained in excel cells.

First of all, you have to specify the tasks names. In order to specify them, click on the select button, then highlight the excel range which contains the names of your activities and click OK.

After that, the others select buttons will activate, allowing you to specify ranges for start times, resource assignement, due dates, task durations and more.
Note that all the data ranges for the data relevant to the tasks must contain the same number of cells as the task names.

You can delete a selection simply clicking on the red cross button on the right, but deleting the task names selection will result in the deletion of all fields.
G4E has a default policy for the start times: in case no values are in the specified range, g4e automatically inserts the current date/time. Also the cell range selected in the durations field is automatically filled with a default duration of one day, if no data is entered in the worksheet. After the start times and durations fields are filled, Gantt4Excel can automatically insert also in the cell range associated to the due dates a default as the current date/time.
2 - Playing with the Gantt chart and adding further features
You can interact with the G4E Gantt charts both through the graphic G4E pane and through the Excel worksheet.
You can use the mouse to move (pan) the chart (right and left arrows over the timeline). Zoom is obtained by putting the mouse on the timeline, pushing the left button and moving the mouse towards right (zoom in) or towards left (zoom out)
You have already seen how to assign a color for each task. But how can you define colors?
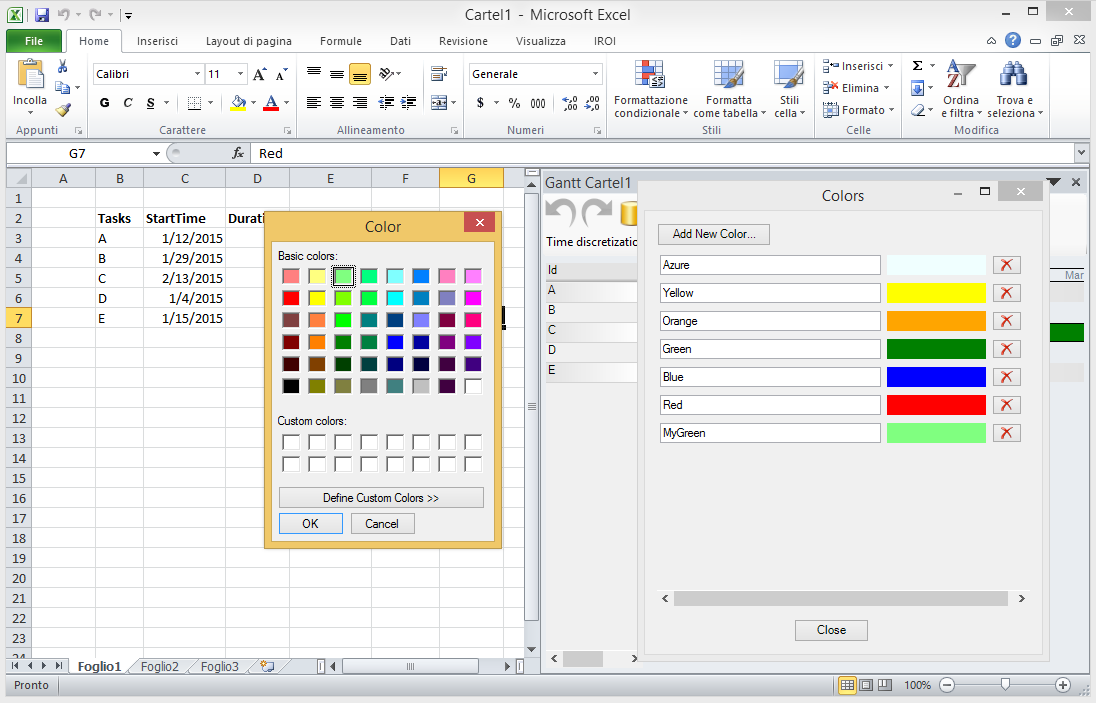
Clicking the colorful button in the gantt pane menu will open the Colors window, from which you can select the color you want and assign it a custom name.
Furthermore, you can move entities in the Gantt chart like activities and due dates arrows using your mouse. The corresponding fields in the excel sheet will be automatically updated.
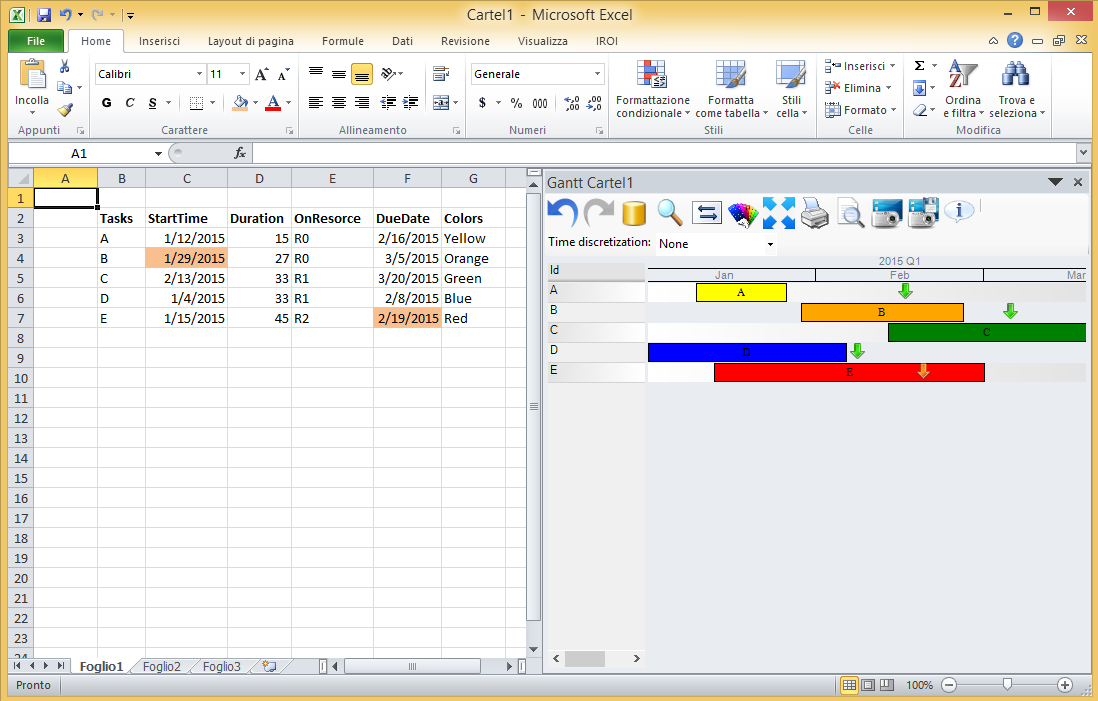

Note how due dates arrows color changed accordingly to the difference between task completion time and its due date.
In addition, you can also stretch the activities in the Gantt chart pane to make them last longer, and even in this case, excel data will update accordingly.


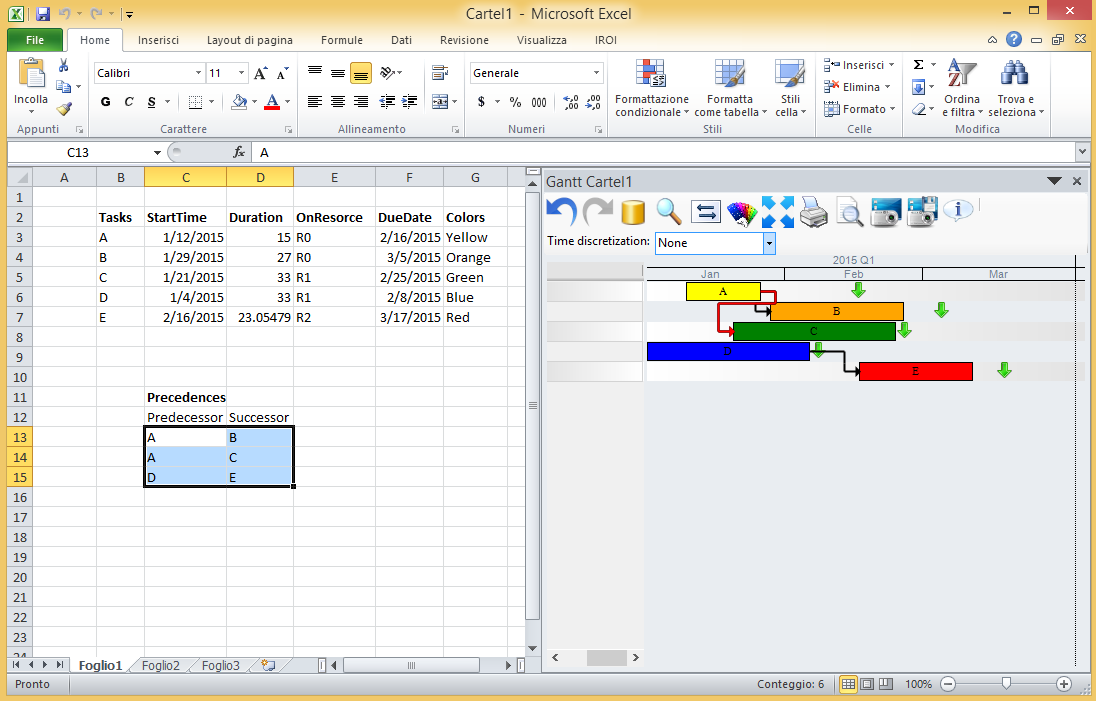
The last feature in the Select Data windows regards Precedences. You can specify the precedence relationships among pairs of tasks in a two columns range on the worksheet: the used convention is that each row identifies a precedence pair and the task in the left column is the predecessor of the task in the right column. Once defined, the precedence relationships are shown in the Gantt chart by means of black arrows from the predecessors to the successors.

By default G4E uses the finish-to-start kind of precedences. If one or more of those precedences are violated, the arrow that represent the violated costraint will become red.
3 - Using Excel formulas to customize the Gantt chart
Formulas are a powerful feature of Excel. G4E exploits this power to make your Gantt chart truly customizable.
You can use formulas to change the color of your tasks based on the occurrence of a certain condition. For example, we will change to red, the colors of those thask which do not satisfy their duedate costraint.

Right now, all tasks are painted green because their duedates are satisfied. But what if we move the 'C' task towards right in order to satisfy its precedence costraint?

Of course it becomes red because of the istantaneous synchronization G4E provides!
4 - Resource Gantt and Activity Gantt views
All the features and examples considered so far have been provided in the Activity Gantt view of the G4E chart pane. Actually no graphic information about the assignment and sequencing of the tasks on the resources has been provided so far.
G4E has two main views: the Resource Gantt and the Activity Gantt views. As said, the latter consists in a Gantt diagram where each row corresponds to a different task. Differently, in the Resource Gantt view each row is associated with a resource and it shows which tasks are assigned to it and which is the task sequence for it.
Resource Gantt and Activity Gantt views are always synchronized. To switch from one view to the other you can click the Two-Arrows button highlighted in the next figure, which shows an example of the Resource Gantt view.

Note that in the resource view task may be overlapped depending on their schedule.
In the previous figure, task 'C' and 'D' overlap for a brief period on the resource 'R1'.

To solve this conflict you should exploits the same drag and drop interactivty seen before and move the desired task towards right.
5 - Other G4E functionalities
You can access other features of G4E using the buttons provided within the Gantt pane.

From left to right you have:
- Undo/Redo
- Buttons to undo and redo the actions performed on the graphic chart pane.
- Select data
- Open the window where to define the worksheet cell ranges containing the data for the chart.
- Center Diagram
- Center the diagram adapting it to the current pane size.
- Switch View
- Switch between task view and resource view.
- Configure Colors
- Open the window where is possible to define, delete and manage colors.
- Fullscreen
- Undock the pane and set it to fullscreen mode, clicking this button again will dock the pane back in its previous positon.
- Print your diagram.
- Print Preview
- Shows a print preview of the diagram.
- Take Screenshot
- Takes a screenshot of your diagram and saves it in the clipboard.
- Save Screenshot
- Takes a screenshot of your diagram and saves it in a file.
- About
- Shows the credit window.
- Time Discretization dropdown
- Using this dropdown menu you can choose the discretization of the time axis in your Gantt chart which is set by default to seconds.
6 - Docking & undocking the Gantt pane
By default the G4E pane is docked on the right side of the excel worksheet.

You can undock the pane dragging it with your mouse and use it as a floating window.

Or dock it on the desired side of your worksheet.
